---
title: '$10 Launch, 400 Traders'
description: >-
This simulation traces a $10 launch through 400 buyers and a mixed exit wave,
showing how spot and floor prices diverge after selling begins.
---
> **For AI agents:** the complete documentation index is at [llms.txt](/llms.txt). Append `.md` to any page URL for its markdown version.
This simulation starts with a creator's **$10 buy**, then sends 400 trader wallets through the market. It answers the practical question: when a token runs up and holders start selling, where do spot and floor end up?
## The scenario
| Input | Value |
| -------------------------------- | --------------------------------------: |
| Creator's initial buy | $10 gross |
| New trader wallets | 400 |
| Initial participant buys | 400 |
| Sellers in the exit wave | 160 unique wallets |
| Repeat buys during the exit wave | 20 |
| Total trade events | 581 |
| Buy and sell fee | 1.25% |
| Creator fee setting | Default 10% market-group share |
| Floor timing | Maximum eligible raise after each trade |
The 400 initial orders get larger as momentum builds: 10–30 USDC for the first 100 buyers, 30–125 USDC for the next 200, and 80–250 USDC for the final 100. During the exit wave, 160 wallets sell 35%–100% of their holdings while 20 existing wallets place another buy.
All values use the v1 curve and high-precision Decimal math before final contract-atom rounding. The full [scenario trace](/images/generated/ten-dollar-launch.json) contains every deterministic input and output.
## The result
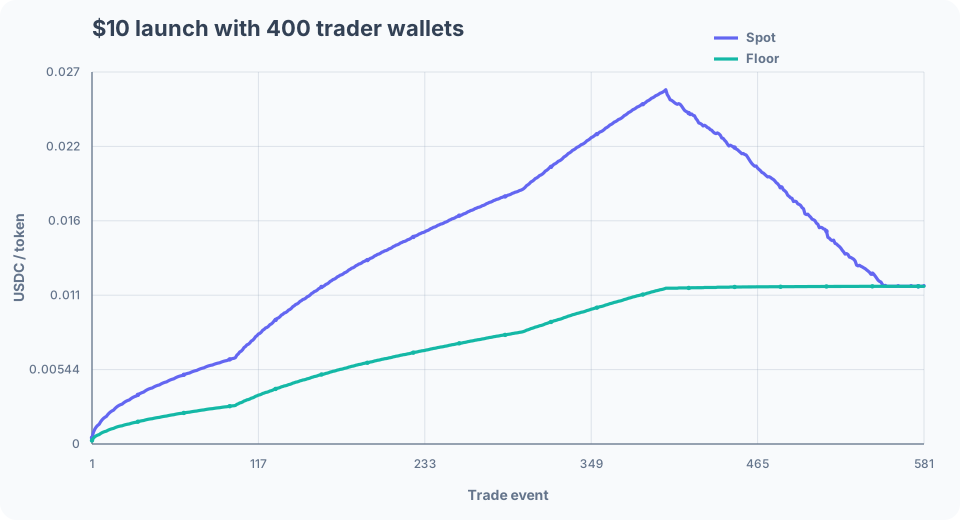 | Checkpoint | Gross buy volume | Gross sell output | Spot | Floor | Floor / spot |
| --------------------- | ---------------: | ----------------: | ---------: | ---------: | -----------: |
| Creator launches | $10 | $0 | $0.0004555 | $0.0002557 | 56.1% |
| 100 buyers | $2,020 | $0 | $0.0063170 | $0.0028204 | 44.6% |
| 250 buyers | $13,633 | $0 | $0.0164092 | $0.0072360 | 44.1% |
| 400 buyers: peak | $34,000 | $0 | $0.0259135 | $0.0113945 | 44.0% |
| 80 sellers processed | $34,780 | $7,429.81 | $0.0177602 | $0.0115118 | 64.8% |
| 160 sellers processed | $35,330 | $12,427.11 | $0.0115875 | $0.0115333 | 99.5% |
The token's spot rises about **57×** from the post-launch quote to the peak. The exit wave then removes most of that premium. Spot finishes only 0.5% above the floor.
The floor behaves differently. It reaches 0.0113945 USDC/token during the buying wave and never follows spot downward. During the exit wave, sell fees add surplus and 20 repeat buys add curve area. Later valid raises move the floor slightly higher to 0.0115333 USDC/token even while spot falls.
## Net flow explains the buying wave
“Net curve flow” adds the fee-exclusive part of buys and subtracts gross curve sell output. It peaks at 33,575 USDC and ends at 22,461.27 USDC.
| Checkpoint | Gross buy volume | Gross sell output | Spot | Floor | Floor / spot |
| --------------------- | ---------------: | ----------------: | ---------: | ---------: | -----------: |
| Creator launches | $10 | $0 | $0.0004555 | $0.0002557 | 56.1% |
| 100 buyers | $2,020 | $0 | $0.0063170 | $0.0028204 | 44.6% |
| 250 buyers | $13,633 | $0 | $0.0164092 | $0.0072360 | 44.1% |
| 400 buyers: peak | $34,000 | $0 | $0.0259135 | $0.0113945 | 44.0% |
| 80 sellers processed | $34,780 | $7,429.81 | $0.0177602 | $0.0115118 | 64.8% |
| 160 sellers processed | $35,330 | $12,427.11 | $0.0115875 | $0.0115333 | 99.5% |
The token's spot rises about **57×** from the post-launch quote to the peak. The exit wave then removes most of that premium. Spot finishes only 0.5% above the floor.
The floor behaves differently. It reaches 0.0113945 USDC/token during the buying wave and never follows spot downward. During the exit wave, sell fees add surplus and 20 repeat buys add curve area. Later valid raises move the floor slightly higher to 0.0115333 USDC/token even while spot falls.
## Net flow explains the buying wave
“Net curve flow” adds the fee-exclusive part of buys and subtracts gross curve sell output. It peaks at 33,575 USDC and ends at 22,461.27 USDC.
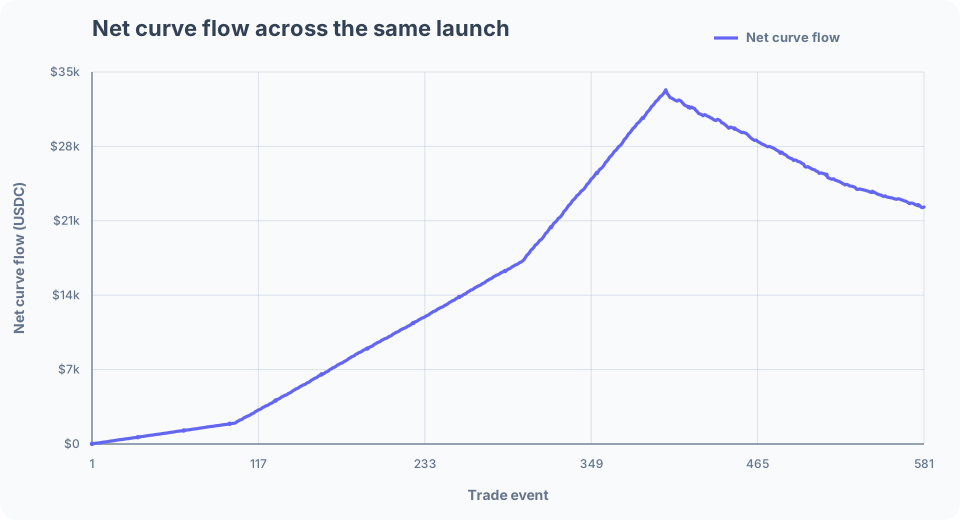 During the uninterrupted buying phase, spot follows the launch identity:
$$
P^2=F_0^2+2m_2R
$$
Here $R$ is fee-exclusive curve inflow. Once sellers arrive, price follows the current piecewise curve. Floor raises and contraction have changed that curve, so two markets with the same net flow can have different floor/ramp geometry.
## What the floor changes about a selloff
Buying causes the vertical movement in spot. A floor raise leaves that live quote in place, makes the sell-side ramp steeper, and raises the price where the curve becomes flat.
During the uninterrupted buying phase, spot follows the launch identity:
$$
P^2=F_0^2+2m_2R
$$
Here $R$ is fee-exclusive curve inflow. Once sellers arrive, price follows the current piecewise curve. Floor raises and contraction have changed that curve, so two markets with the same net flow can have different floor/ramp geometry.
## What the floor changes about a selloff
Buying causes the vertical movement in spot. A floor raise leaves that live quote in place, makes the sell-side ramp steeper, and raises the price where the curve becomes flat.
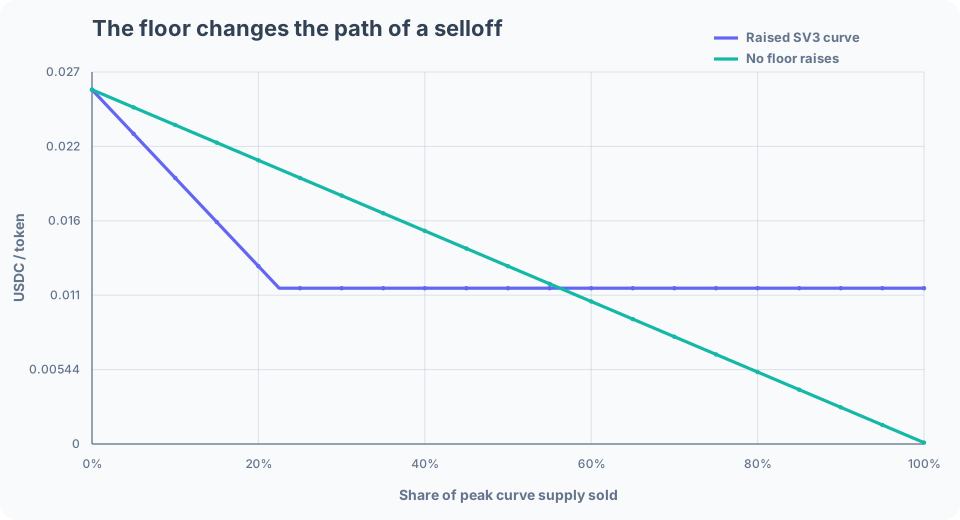 This produces three distinct parts of SV3 price action:
1. **Net buys create the run.** USDC enters, supply expands, and the marginal spot rises.
2. **Floor raises convert reserve geometry into a higher minimum.** Spot is unchanged at the moment of the raise, while the sell-side ramp becomes steeper.
3. **Net sells move through that ramp and erase the premium.** Once spot reaches floor, additional floor-priced exits reduce supply and reserve together without printing a lower canonical price.
## Scope of the simulation
The trace shows deterministic protocol behavior for one order sequence. Demand, timing, wallet behavior, MEV, gas, and external DEX prices sit outside the model. Different order sizes and sell timing produce a different spot path.
The maximum-raise assumption shows the highest floor path available when a caller submits every eligible transaction. Delayed calls leave spot unchanged but postpone floor growth. Above $100,000 of net-inflow high-water, v1 cooldown bands also delay consecutive raises.
For the equations behind every line, continue to [Curve & Floor Math](/protocol/curve-and-floor).
This produces three distinct parts of SV3 price action:
1. **Net buys create the run.** USDC enters, supply expands, and the marginal spot rises.
2. **Floor raises convert reserve geometry into a higher minimum.** Spot is unchanged at the moment of the raise, while the sell-side ramp becomes steeper.
3. **Net sells move through that ramp and erase the premium.** Once spot reaches floor, additional floor-priced exits reduce supply and reserve together without printing a lower canonical price.
## Scope of the simulation
The trace shows deterministic protocol behavior for one order sequence. Demand, timing, wallet behavior, MEV, gas, and external DEX prices sit outside the model. Different order sizes and sell timing produce a different spot path.
The maximum-raise assumption shows the highest floor path available when a caller submits every eligible transaction. Delayed calls leave spot unchanged but postpone floor growth. Above $100,000 of net-inflow high-water, v1 cooldown bands also delay consecutive raises.
For the equations behind every line, continue to [Curve & Floor Math](/protocol/curve-and-floor).